
Explaining the emergence and consolidation of right-wing populism: Part I
Stylised facts, or what has actually happened?

Introduction
In the next couple of posts, I’ll expand on a presentation I gave at the end of last year (link here), which surveyed the literature on the causes and consequences of right-wing populism (RWP) or the radical right.1 I’ll also explore the potential for certain policies or programmatic shifts that might weaken the radical right.
Our world is changing at a dizzying pace, making it even harder for academic research to keep up with current events. Still, I believe a better understanding of this literature could help improve public debate, where introspection and anecdotes often trump clear theorising and systematic evidence.
It may also help us avoid endlessly rehashing the same debates, each time blithely ignoring the best available theoretical and empirical research. Some of the choicest examples include: why so many voters seem to act against their economic interests, the relative importance of economic versus cultural factors, and whether adopting radical-right positions on immigration ("accommodation") yields net electoral gains.
That said, I recognise the barriers to entry are high for non-specialists. And the political science discipline hasn’t, I daresay, done enough to make these debates accessible to interested but time-constrained lay readers. After all, reading the vast number of papers takes time and effort.
As it happens, I’m currently in the privileged position of being paid to do exactly that. So, in that spirit, I’ll try to outline my reading of the quantitative literature on populism. I should stress that I’m not an authority on the topic or an active contributor to the academic debate—nor do I lay claim to any originality. But I do have more time than most, and I hope my take can serve as a useful starting point for those who want to dig deeper. Let me know if I’ve missed something important—or gotten anything wrong.
To set the stage for this discussion, we first need to be clear on what we mean by right-wing populism, and what this series will and won’t cover. On that basis, I will then introduce what I regard as the key stylised facts that characterise the transformation of European politics over the past few decades.
Definition and scope conditions
While I do not want to get bogged down in definitional disputes, some conceptual preliminaries are necessary. A useful starting point is Cas Mudde’s "thin definition" of populism, widely accepted in the political science literature.2 Mudde (2004, 543) defines populism as a "thin-centred ideology that considers society to be separated into two homogeneous and antagonistic groups: the pure people and the corrupt elite. It argues that politics should be an expression of the general will of the people."
What makes this definition particularly helpful is its adaptability: it can be combined with various "host" ideologies, including Marxism, communism, anarcho-libertarianism, and others. Conceptually, this allows for different kinds of populism to emerge.
While left-wing populists often pit diligent workers against exploitative and venal capitalists, right-wing populism’s host ideology is nativism, defined as the commitment to protecting the native "in-group" against perceived external threats. This inclusion of nativism distinguishes right-wing populism by emphasising nationalistic, anti-immigrant, and ethnocentric positions.
In the following discussions, I'll focus primarily on Europe, partly due to the wealth of empirical evidence available for this region, and partly because of my own academic interests and biases. My hope is, however, that my summary might help readers better understand populist dynamics in other regions as well.
14 stylised facts
With those conceptual points in place, we can now turn to the key changes that have taken place on both the demand and supply sides of European politics. The former refers to the beliefs, preferences, and behaviour of (eligible) voters, and the latter to the positions and nature of political parties.
Fact 1: The global rise of right-wing populism
I’ll hardly need to convince you that the rise of right-wing populism (RWP) has been global. Nevertheless, it is useful to get a sense of the magnitude of the rise of right-wing populism. Funke et al. (2023) show that the share of populist governments across 60 countries has dramatically increased since the late 1980s — from well below 5% to just under 25%.

The figure also shows that left-wing populism has risen a fair bit, which brings us to an important geographical scope condition. The rise of left-wing populists in government is a mainly Latin American phenomenon (e.g. Evo Morales in Bolivia). The European variant of populism has been predominantly of a right-wing nature, which also becomes evident when examining the figure below that is based on the PopuList database by Rooduijn et al. (2023).

While covering a shorter time period, the figure is less “conservative” in that it visualises the evolution of vote shares over time, focusing on populist party families’ vote shares rather than government participation. The average vote share of right-wing populists has nearly tripled from the mid 1990s to 2022.
Fact 2: Increasing electoral volatility
But rising support is only part of the story. Equally important is how unstable electoral landscapes have become, with voters increasingly willing to shift allegiances — or abandon mainstream parties altogether — and new parties entering the fray, and others disappearing. These developments are captured by what political scientists call electoral volatility.
Electoral volatility, defined as change in vote shares for parties between consecutive elections, has increased in Western Europe, especially since 2000. This volatility is usually measured via the Pedersen index,3 which, letting N denote the number of parties and p the vote share of some party, is formally defined as:
Below I have taken Emanuele’s data and computed the mean volatility by election year across 20 Western European countries. The lines represent the fit to the points of loess regressions (spline 0.5) to illustrate the trends over time. The purple line represents the mean Pedersen index for each election year, which increased from just over ten percentage points in 2000 to almost 17 in 2024.

As Powell and Tucker (2014), among others, note, the Pedersen index conflates two sources of electoral volatility: vote switching (intra-system volatility) and party entry/exit (extra-system volatility).4 Formally, the total Pedersen index can be decomposed as:5
Emanuele luckily has data on both components, visualised by the red and blue lines. Vote switching is not only the biggest component of total volatility; it has also increased since 2000, reflecting, inter alia, declining voter loyalty. While party entry (and exit) used to be very low for most of the post-WWII period, it has risen quite a bit since 2010.
Another common way to capture these trends is to look at the effective number of parties, which — following Laakso and Taagepera (1979) — is defined as the inverse of the sum of squared vote (or seat) shares for each party in a given country or (using similar notation to above):
As can be gleaned from this formula, the #EP varies from 1 (when one party has a vote share of 100%) to N, when all parties have equal vote shares (just consider the first- and second-order conditions w.r.t. p).
The Comparative Political Data Set (CPDS) by Armingeon et al. contains the #EP for elections (vote shares) and the legislature (seat shares), with the former always at least as high as the latter — given that many countries have minimum thresholds (in terms of vote shares) for parliamentary representation. The figure below uses these data to plot the mean #EP over time and across different European regions as well as North America, Australia, and New Zealand.

In line with figure 3, we can see a steady increase in #EP in Northern and Western Europe, and sharp rise in Southern Europe post 2010 (and early in 1989/1990). Eastern Europe saw a steep increase after democratisation; since then, the party system has become more institutionalised, though is still rather fragmented. Australia/New Zealand show stable, modest fragmentation, with a slight increase after New Zealand adopted mixed-member proportional representation (MMP) in 1996. Northern America remains consistently low, reflecting the dampening effect on the #EP of single-member-(simple)-plurality electoral systems (Duverger’s “Law”).
Fact 3: The decline of mainstream parties and the rise of challenger ones
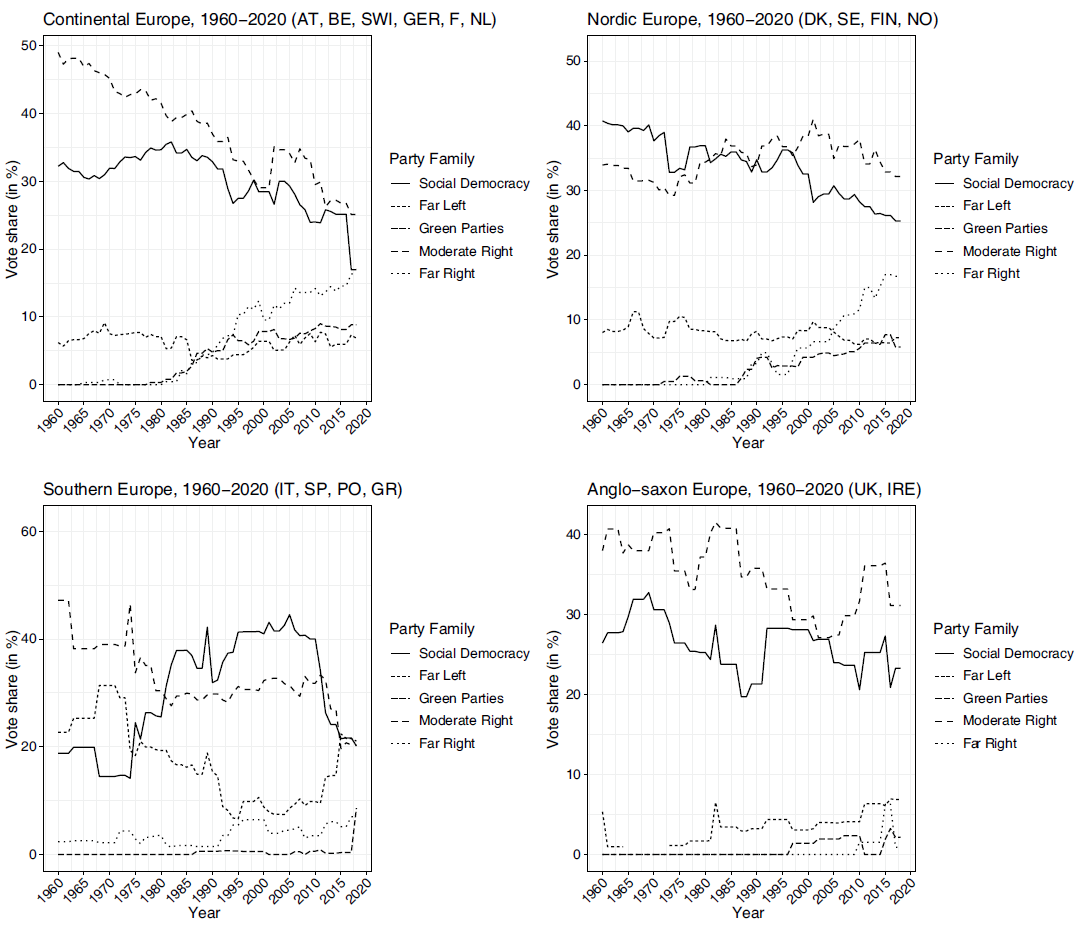
This volatility reflects more than just momentary discontent. It’s part of a deeper structural shift: the erosion of mainstream parties and the growing strength of challengers, parties without government experience. The figure by De Vries and Hobolt (2020) makes this point nicely.

Figure 6 reinforces this conclusion while adding nuance. The mainstream right’s decline from 1960 to the late 1990s in continental Europe was steep — an under-appreciated development. While it recovered in the first decade of the new millenium, since 2010 it has, more or less, returned to its pre-2000 trend. In the Anglo-Saxon world, the centre right’s decline began later, in the mid-1980s, but was similarly steep. Since the mid-2000s the pattern has been more cyclical. In the Nordics, the right has lost ground fairly steadily, albeit less dramatically than elsewhere. In Spain and Portgual, centre-right parties — sullied by their association with the authoritarian regimes of Franco and Salazar — suffered a massive electoral shock after these countries democratised in the mid-1970s.6
The figure documents three other momentous developments: the rise of green and far-right challengers as well as the decline of social democracy.7 We have already discussed the rise of the far right, but not that of green parties. Since they emerged in the 1980s, have steadily gained ground, particularly in Continental and Nordic Europe, where they now claim around 10% of the vote. In Southern and Anglo-Saxon Europe, their presence is more muted, with only minor growth and fluctuating relevance. The decline of social democracy post 2010 is mainly a story of continental European and Nordic countries. In Southern Europe, the pattern is more volatile: surging after democratisation, especially in Portugal and Spain, but declining from the mid-2000s onwards. The Anglo-Saxon countries exhibit a more jagged pattern, with noticeable dips and partial recoveries, though the overall trend is also downward.
The question is then, of course, which parties former supporters of social democratic parties switch to. While pundits tend to hold very strong priors about this, recourse to actual data is rare — and often also not all that effective in shifting these priors. That said, Abou-Chadi et al. (2024) have an eminently readable research brief that addresses exactly this question.
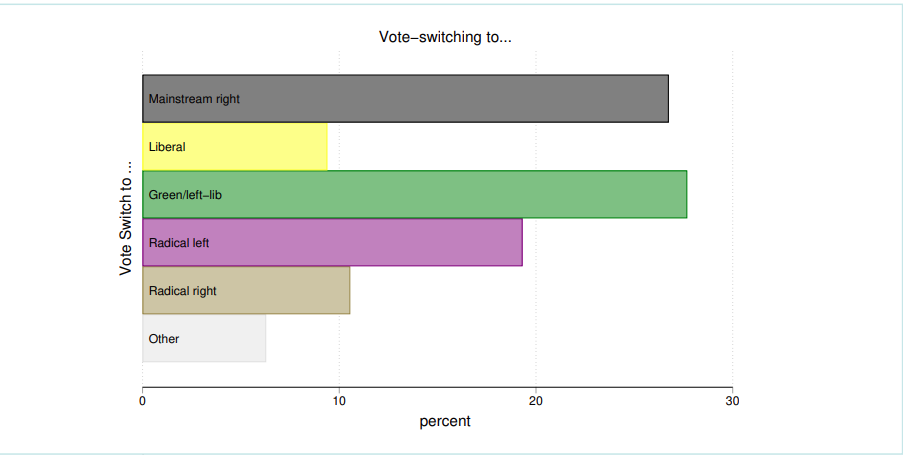
Based on survey data for Austria, Denmark, Finland, Germany, the Netherlands, Norway, Sweden, and Switzerland, they show that just over 10% of social democratic voters switch to the radical right. Reading the news might make you think the share is closer to 80%. Most voters, however, either switch to the mainstream right or green parties.
Fact 4: Declining voter turnout
Before we examine voting behaviour more closely, let us briefly dwell on who votes in the first place, to wit, turnout. Worries about widespread political apathy are commonplace and, arguably, most potently illustrated by the secular decline in turnout that many European countries have witnessed since 1960. Figure 8 depicts a fairly stark decline in turnout in Southern and Northern Europe, and a somewhat less pronounced decrease in Western Europe. Eastern Europe, where data becomes available only after the fall of communism, begins at a significantly lower turnout level and shows only a modest recovery in recent years.

Both the secular downward trend and differences in the steepness of the negative slope raise important questions about the drivers behind changing electoral participation over time. Kostelka and Blais (2021) investigate long-term turnout trends using an original dataset covering over 1,000 parliamentary elections in 91 democracies from 1939 to 2019. They argue that variation in turnout across countries is driven by two factors: differences in generational replacement and electoral mobilisation.
Generational replacement refers to the gradual shift in the electorate as older cohorts, socialised in periods of higher civic duty and stronger partisan attachment, are replaced by younger generations who have come of age in more individualised, post-materialist societies. These younger cohorts tend to feel less obligation to vote and often exhibit weaker ties to political parties. Unlike life-cycle effects, where political engagement increases with age, generational effects suggest lasting differences in turnout behaviour shaped by early-life socialisation. Since this kind of generational replacement has taken place across Europe, it helps explain the near uniformity of the trend documented in the figure above.
Electoral mobilisation, meanwhile, refers to parties’ success (or lack thereof) in getting people to vote. Where parties are strong, elections are closely contested, and ideological differences are easy to identify, mobilisation tends to be higher. In contrast, when parties are fragmented, poorly institutionalised, or disconnected from voters, mobilisation weakens. This helps account for regional differences in turnout: in Western Europe, long-established party systems and stable competition have sustained high levels of mobilisation. In Southern and especially Eastern Europe, weaker party systems, political volatility, and post-authoritarian legacies have stymied these efforts, contributing to declining or persistently low turnout.
Fact 5: Lower turnout among young and lower-income voters
Declining turnout, however, isn’t uniform across all groups. Let’s now explore how income and age affect who shows up to vote. We have already noted that younger people are, on average, less likely to vote. This is also borne out by this figure from
’s Democratic Capitalism at the Crossroads.8 Crucially, however, the granularity of the data allows Boix (2019) to disaggregate the probability of turning out by quintile for Finland, Netherlands, France, and the UK. The conclusion is clear enough: the probability of voting declines in income (for now, this is just a correlational, not a causal, statement).
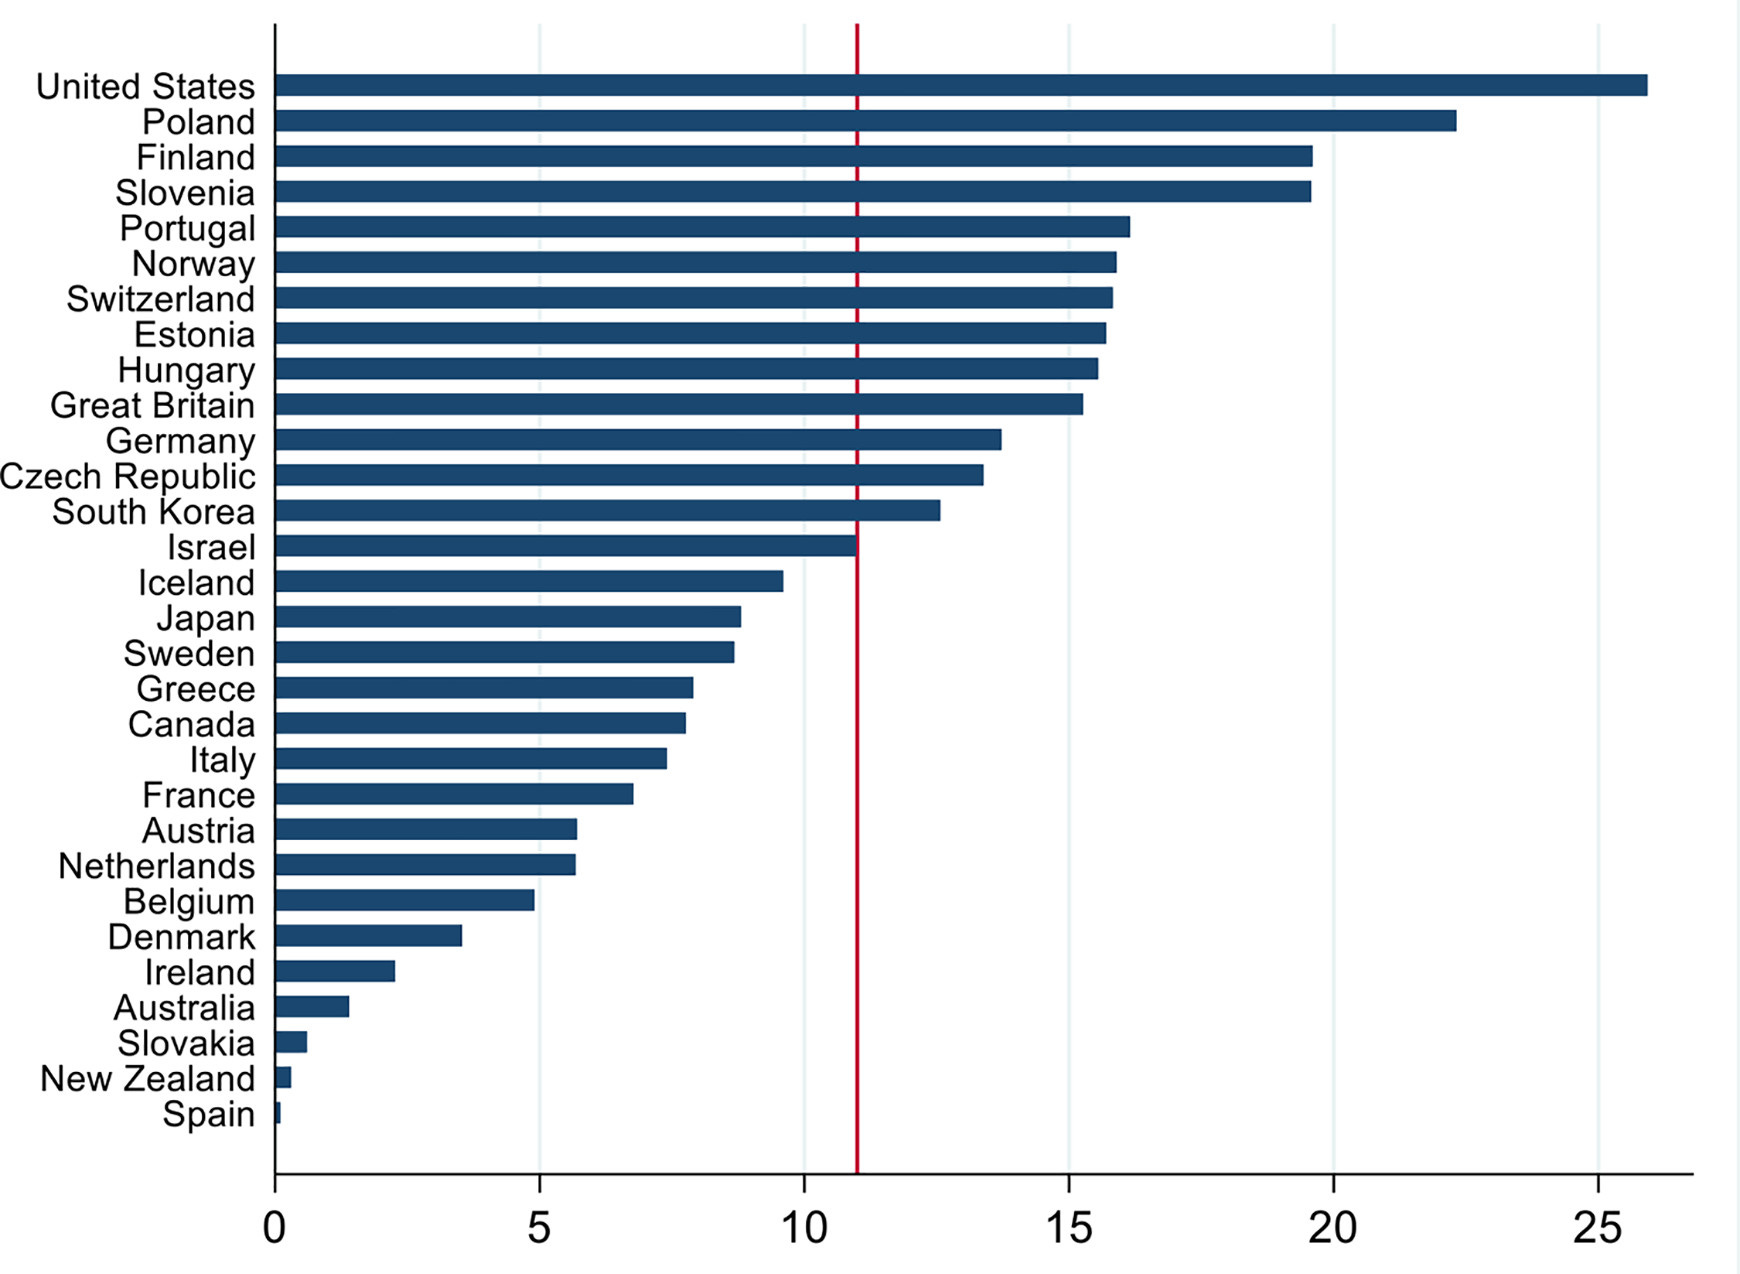
One limitation of Boix’s figure is that it only captures four countries, raising the question as to whether the income gap in turnout should really pass muster as a “stylised fact”. Polacko’s (2021) analysis of 102 elections in 30 advanced democracies between 1996 to 2016 alleviates these concerns; his figure depicts the difference in turnout rates between the top and bottom quintiles, averaged over the entire time period. With the exception of Spain, those in the top quintile are more likely — by, on average, more than 10 percentage points — to turn out than those belonging to the bottom one.
The other limitation of these figures is that they capture (or do so only implicitly) only one point in time, shedding no light on how the income differential in turnout propensity has changed. The recently compiled individual-level data on voting behaviour in 55 countries by Gethin, Martínez-Toledano, Piketty, and an army of research assistants — and extensively summarised in their book — allows us to dig a little deeper in that regard.

This figure plots the mean share of those who indicate that they voted by income quintile. The overall conclusion is similar to that implied by Boix’s graph: income and turnout propensity are positively related. Yet, the magnitude of the differential varies by country (relatively low in Denmark; quite pronounced in Germany and the UK) — as does the evolution of that differential over time (constant/declining in Sweden; increasing in Germany). The growing mass of young and relatively poor non-voters matters, not least because right-wing populists sometimes draw a fair amount of their support from the mobilisation of non-voters (Gennaro et al. 2024).
Fact 6: Higher dimensionality of the space of political competition
Understanding who votes is crucial — but so is understanding how changes in the structure of political preferences have resulted in a higher-dimensional space of political competition. Indeed, non-economic, cultural concerns have become increasingly prominent in public discourse, as reflected in the growing tendency of political pundits to invoke “identity politics” — a poorly defined and therefore much-loved concept that is well suited to vague, unfalsifiable predictions or data-free post hoc rationalisations — as a catch-all explanation for a wide range of political developments.
A generous interpretation would be that “identity politics” is simply a clumsy attempt to convey a well-established insight from political science: a substantial body of literature has documented the emergence of a second, non-economic dimension of party competition since the mid-1990s, in addition to the traditional economic left–right divide that structured political contestation throughout much of the Cold War period.
Crucially, however, the way this second dimension is conceptualised differs markedly.9 Kitschelt (1994), for instance, argues that the space of party competition is defined by the economic left-right dimension and the non-economic libertarian-authoritarian dimension. Hooghe et al. (2002), in contrast, point to the GAL/TAN spectrum (green-alternative-libertarian/traditional-authoritarian-nationalistic) as the second dimension. More recently, Norris and Inglehart (2019) have argued that the populism-cosmpolitanism divide constitutes the non-economic dimension of party competition, whereas De Vries (2018) has pointed to the cosmopolitan-parochial divide. Enke (2020, 2024) and Zollinger (2023) highlight the tension between universalist and particularist moral orientations as a fundamental axis of political conflict.10
In what way has the emergence of a non-economic, second dimension and the changing nature of party competition hurt mainstream parties and benefitted populist ones? The answer that has been explored in an extensive literature is that the reconfiguration of the policy space has led to the de-alignment between voters and mainstream parties, i.e. a decrease in voters' identification with those parties. This has manifested itself in higher electoral volatility (see above). In fact, as I will argue in a later post, three important drivers of this de-alignment are: (a) the increase in the salience of the second dimension, (b) the convergence on the economic dimension by mainstream left and right parties, and (c) the internal divisions on the non-economic dimension of mainstream parties, which populists skillfully capitalised on.
But I am getting ahead of myself; first, we need a better understanding of how parties positioned themselves in this policy space and how their positions changed over time. Figure 12, taken from the
book I mentioned above, captures the first important development: the convergence of the mainstream right and left on the economic dimension (see also Polacko 2023) from 1970 to roughly 2010, though the trend has reversed slightly since then.Programmatic convergence is interesting for a number of reasons, among them the well-known observation from the party competition literature that — as parties become more similar ideologically — the relative importance of valence or non-programmatic considerations (e.g., non-policy traits like competence) increases for voting behaviour. One important component of valence is competence, reflecting the intuition that if you have to choose between two parties that offer similar economic or redistributive policies you are, holding other determinants constant, more likely to choose the one that you deem more competent. This is, in fact, one interpretation of the strategy that third-way social democrats — chief among them Tony Blair and Gerhard Schröder — and, on the right, Angela Merkel pursued. Programmatically, they moved to the centre, while trying to convince voters that they were more competent than their competitors.

You might object that what we really care about is not the positions of parties per se, but their distance from the median voter. In the figure below, I try to address this objection in an admittedly imperfect way — by visualising the difference between party’s positions (measured via manifesto data) on the general left-right dimension and the Kim-Fording measure of the median voter’s positions. The UK, for instance, provides a particularly clear example of convergence towards the median voter from the 1980s onward. Similarly, the SPD’s move to the middle under Schröder is also clearly visible. While both manifesto data and the Kim-Fording measure have their flaws, this figure provides a rough sense of the parties that moved the median, and those that did not.

The work11 by Gethin et al. (2022) reveals at least three further important aspects. First, the convergence largely disappears once we compare the overall left and right camps, suggesting that the other left (socialist, communist, etc.) and right (conservative, liberal parties) did not converge on the economic dimension.

Second, anti-immigration parties (aka right-wing populist ones) started out as pretty right-wing on economics, and have become considerably moderated ever since. The Alternative für Deutschland (AfD), which was originally founded by a coterie of eurosceptic professors, and the Freiheitliche Partei Österreich (FPÖ) are cases in point (Rathgeb 2024). Third, figure 14 shows that the radical right has adopted increasingly more conservative or authoritarian positions on the “socio-cultural” dimension — and, with the emergence of culturally progressive, green parties this has given rise to polarisation on the non-economic dimension of competition. Let me note, parenthetically, that much of this is also true in the US, where polarisation between Democratic candidates and Republican ones is also more pronounced on the cultural dimension (see figure 5 of Longuet-Marx’s (2024) impressive Job Market Paper).
Fact 7: Representation gaps tend to be greater on the non-economic (“cultural”) dimension for mainstream parties
As before, you might wonder where parties and politicians stand relative to voters in this two-dimensional policy space. This question is actually not as easy to answer as it appears, and I hasten to add that more research needs to be done.
To my mind, some of the best research in the European context is by Laurenz Guenther. In his JMP, he harmonises responses from both citizens and elected parliamentarians to (almost) identical survey items. Parliamentarian data come from two main sources: the European Candidate Study 2009, which surveyed nearly all candidates for the European Parliament, and the Comparative Candidate Survey, covering national parliamentary candidates from 2005 to 2013. On the voter side, he uses the European Voter Study 2009, explicitly designed to align with the candidate study. This harmonised design enables direct, policy-level comparisons between elected representatives and the public across 27 EU member states. Unlike manifesto data, which infer party positions from coded campaign texts, Guenther's method captures expressed preferences on identical items, improving comparability. Still, the analysis is temporally constrained—mainly reflecting 2009—and relies on candidate self-reporting.
With these caveats in place, figure 15 shows the positions of parties (averaged across their MPs) in the two-dimensional policy space — relative to the mean voter (in standard deviations). The mean voter’s position is accordingly indicated by the two grey dashed lines.

What this figure reveals is that almost all mainstream parties, even conservative ones, are more culturally liberal / progressive than the mean voter, whereas right-wing populist ones are — unsurprisingly — the only ones that are more conservative. On the economic dimension, we observe the pattern that is so familiar to us from the “good old” days of one-dimensional political competition about redistribution. The paper also contains a country-by-country breakdown of the economic and cultural “representation gaps”. Nevertheless, the overall conclusion is clear — at least in 2009, elected parliamentarians across Europe were culturally more liberal than the average voter.
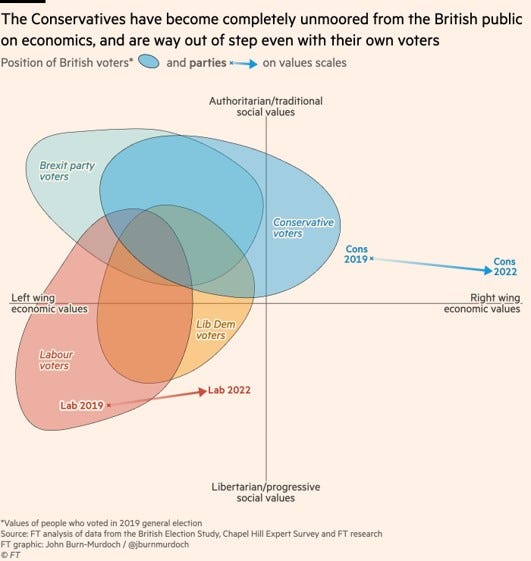
As mentioned earlier, one limitation of Guenther’s data is its temporal scope — it may no longer reflect current political dynamics. The British case, particularly the brief premiership of Liz Truss, lends some plausibility to this concern (though it can reasonably be argued that a single-member-simple-plurality system, which enables parties to more easily bundle unpopular positions on one dimension with popular ones on another (Roemer et al. 2007), is a most-likely case and therefore provides an upper, rather than a lower, bound for the “coefficient estimate”). Under Truss, as the chart by the FT’s
brings home to us, the Tories veered to the right — much more so than their voters preferred. Yet, on cultural issues they adopted a fairly popular position. This shows that representation gaps are by no means always the result of culturally liberal parliamentarians trying to foist their positions on voters; they can also result from anarcho-capitalist, libertarian experiments (sound familiar?).Fact 8: On average, voters’ attitudes on the cultural dimension have changed little, though its salience has increased
The final point I want to make about the two-dimensional space of political competition is that — while voter preferences on the “cultural” dimension have remained rather stable over the last two and half decades (see the figure below by Danieli et al. 2024 and also Bartels 2023) — the salience of that dimension has increased markedly. Put simply: an under-appreciated reason for the electoral success of right-wing populists is not that, on average, the prevalence of racists, xenophobes, homophobes [in fact, there are less], etc. has risen greatly — but that these issues matter more to people and therefore their voting decisions.

To buttress the point about changes in salience, consider the following figure from the Danieli et al. paper.
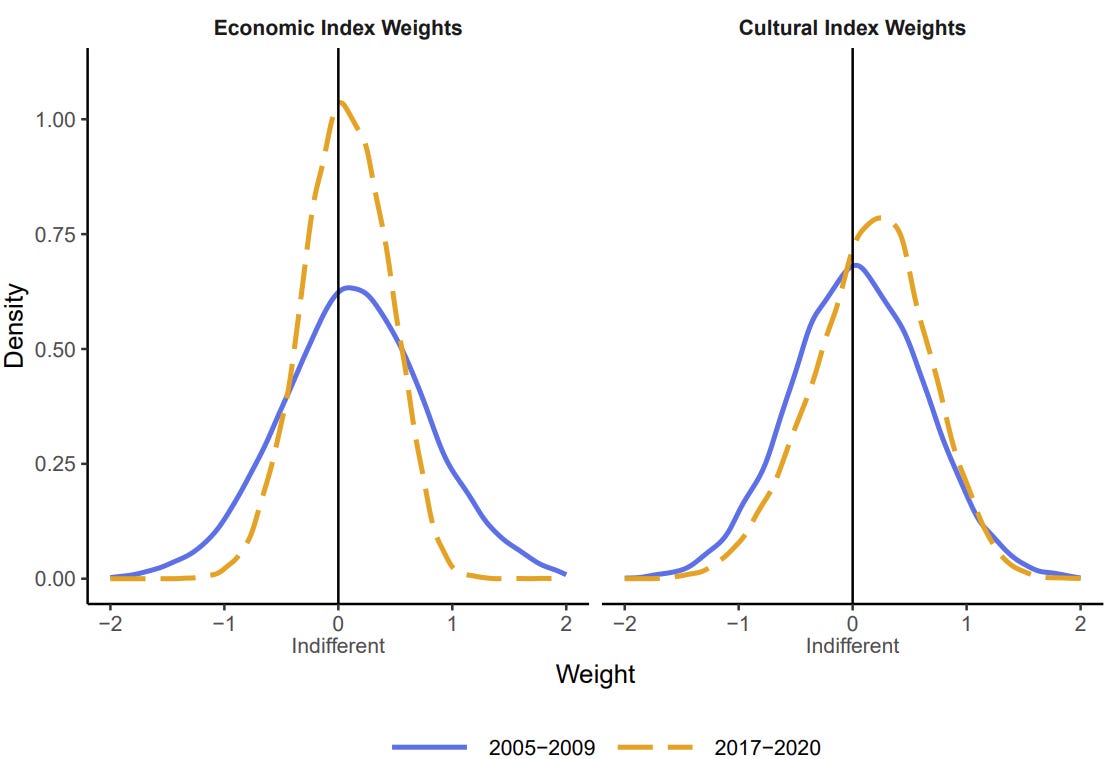
Based on a structural model of vote choice, they can estimate the relative weights voters attach to the economic and cultural dimensions, respectively. Doing so by time period reveals that more recently the relative importance of non-economic, cultural considerations has increased for vote choice.
Fact 9: The occupational and educational re-alignments
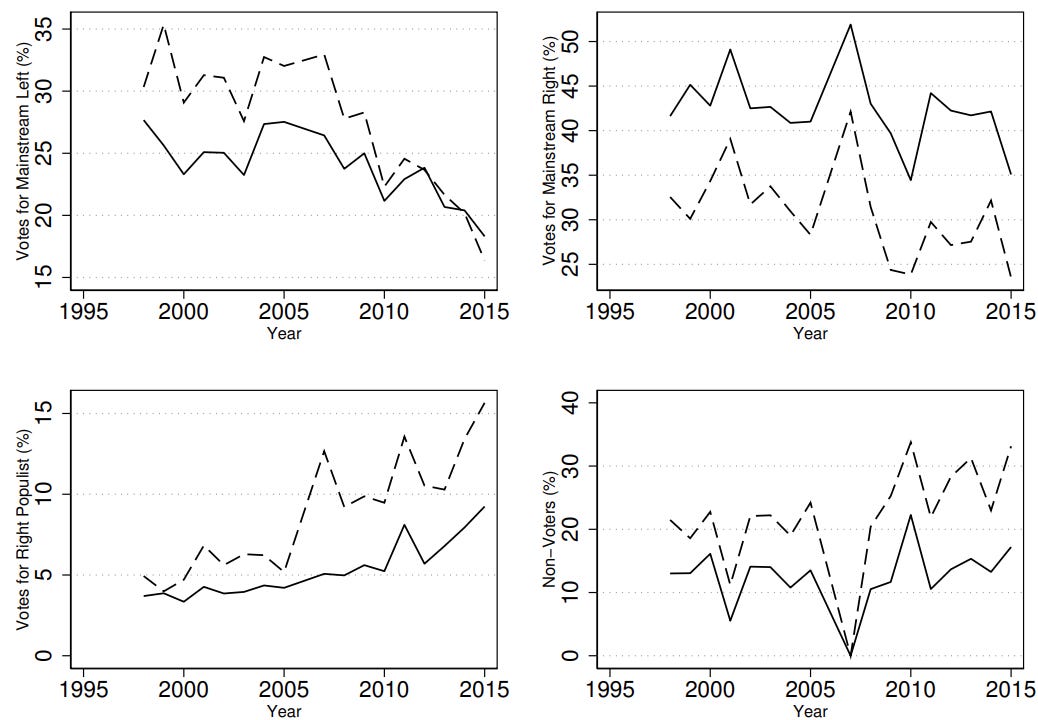
In light of the above, it won’t come as a huge surprise that the electoral coalitions of centre-left and centre-right parties have changed considerably. The graph by Gonzalez-Rostani (2024), which is based on ISSP data, speaks to the “occupational re-alignment”. It shows that the mainstream left has lost votes among both non-routine, cognitive and routine workers, whereas the pattern is somewhat more volatile for the mainstream right. These workers have increasingly turned to the populist right or become non-voters (bottom panels).
As for the educational re-alignment: it used to be the case that education and income reinforced each other. Centre left/social democratic parties drew their electoral support from lower-income voters, with relatively low education (typically not more than secondary). By contrast, centre right/conservative/Christian democratic parties drew their support from higher-income voters, with relatively high education. Panel A of the figure below shows exactly that.

Over the last three decades, however, education and income have developed into non-colinear factors (Gingrich and Haeusermann 2015, Gethin 2022, Kitschelt and Rehm 2023, Longuet-Marx 2024). Panel B indicates that the electoral coalitions are now:
Centre left: high education and low to medium income
Centre right: high income (lots of variation across education)
Radical right: low education (lots of variation across income)
Greens: high education (lots of variation across income)
Fact 10: Regional heterogenity in support for populists
Support for populist parties is unevenly distributed within countries, exhibiting significant regional variation.

In figure 21, I use the European NUTS-Level Election and PopuList databases to compute the deviation of right-wing populist vote share of a given NUTS 3 region from the country mean, averaged across all parliamentary elections between 1990 and 2020. The regional patterns are hardly surprising (e.g. East-West divide in Germany, which, let me add, is not just due to the GDR, as despicable as that regime was). They underscore a crucial point: sub-national variation in populist support remains a puzzle worth explaining.

This nice graph by Jane Gingrich sheds more nuanced light on the regional distribution of the different voter coalitions. Mainstream social democrats once thrived in cities but declined across all regions, albeit slightly less so in small cities. The moderate right, stronger in rural and suburban areas, also declined, though less sharply after 2010. In contrast, Greens and radical left parties are now concentrated in major cities, while right-wing populists are growing across all areas, though their rise is “slowest” in major cities.
Fact 11: The decline of mainstream parties and generational replacement
Mitteregger (2024) illustrates how generational shifts contribute to the decline of mainstream left parties, with younger voters increasingly favouring Green and alternative left parties.

This graph demonstrates a clear age gradient in party preferences: older cohorts remain more loyal to traditional social democratic or mainstream left parties, while younger generations show a marked preference for Green and more radical left-wing parties. This generational divide is consistent with a political socialisation story à la Inglehart. Younger cohorts — on account of having grown up in politically secure times — have come to prioritise non-economic or “post-materialist” issues that push them to supporting the “new”, as opposed to the old, left. Yet, this is not only explanation for the pattern that Mitteregger documents.

Mitteregger’s (2024) analysis also reveals somewhat more complex generational dynamics on the political right, with younger cohorts showing increasing, though non-linear, support for far-right parties at the expense of traditional centre-right alternatives.
Fact 12: The gender gap in support for the radical right
The popularity of the radical right, relative to the mainstream right, brings me to the well-documented gender gap in support for right-wing populist parties (Green et al. 2023, Anduiza and Rico 2024, Clark et al. 2023,
2024a, 2024b, 2024c, 2024d, 2024e). On average, men are significantly more likely to vote for these parties than women — though I wish to note that the magnitude of this gap very much depends on the political supply side, especially the positions that parties take and the issues they choose to politicise (Kedar et al. 2024, Rettl et al. 2024, Landro 2025). There are myriad ways to illustrate this fact; I chose this graph by Milosav et al. (2025) because of its recency. It is based on the 2024 European Election Study (ESS) and plots the propensity to vote by gender and birth cohort.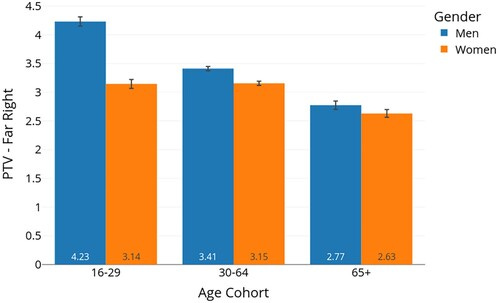
The connection to the second Mitteregger plot above becomes evident when we consider the graph below by Milosav et al., which very much speaks to the recent literature and debate about the gender backlash among young men potentially making them a new reservoir for the radical right (Abou-Chadi 2025, Off 2023, Off et al. 2022, Mathisen 2025).
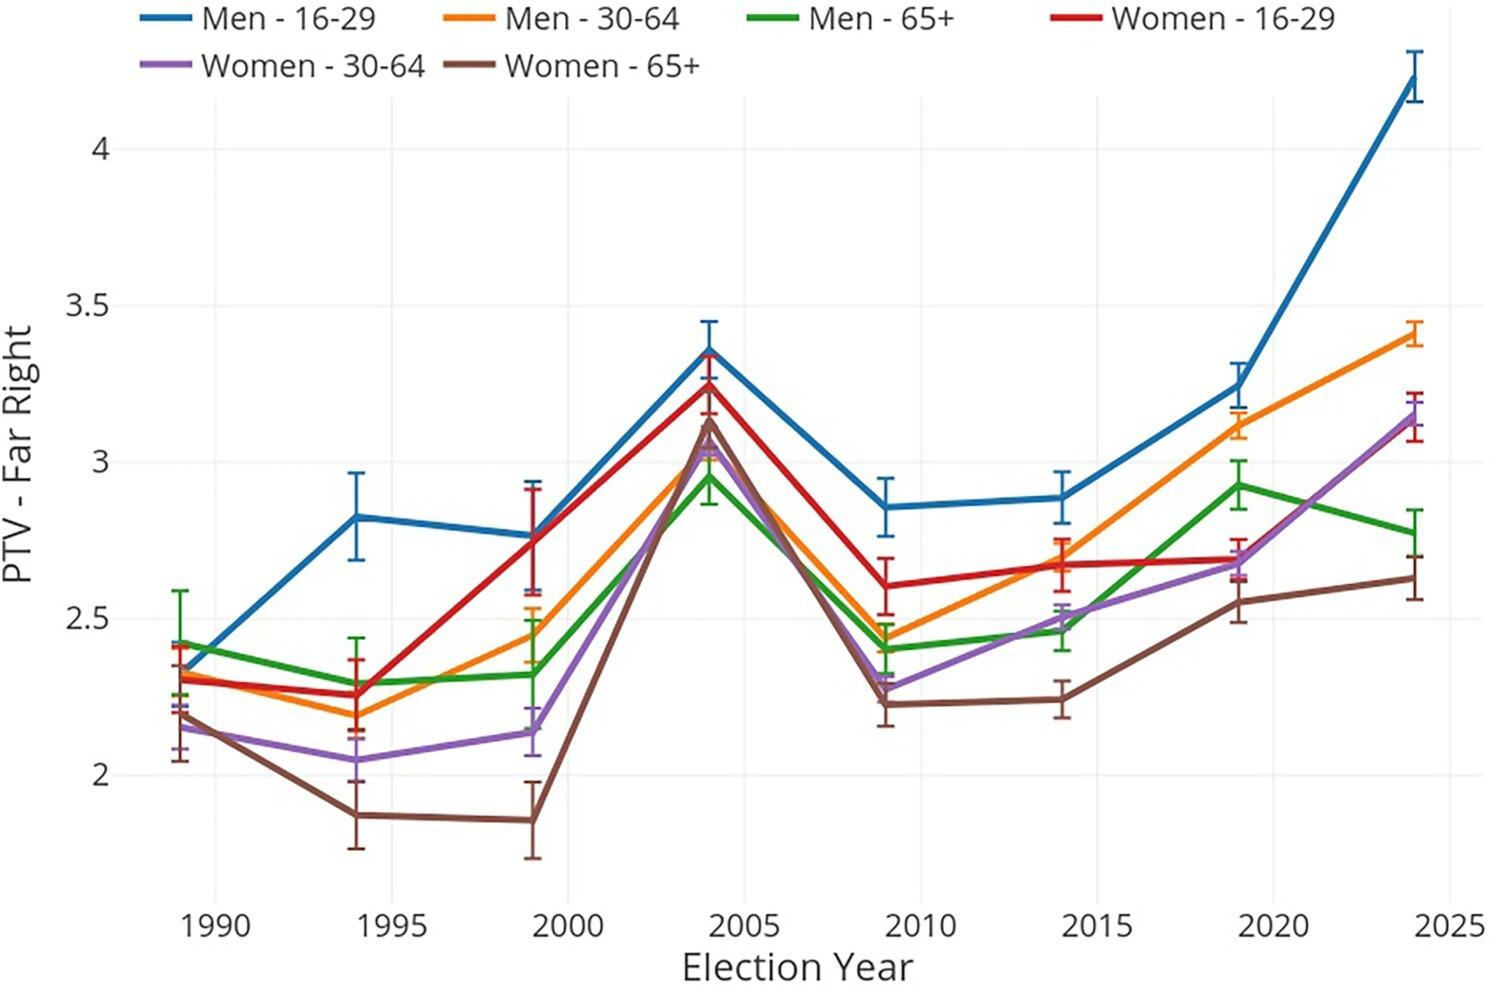
Understanding why the gender gap has widened so starkly over the past five years is, I dare say, going to be one of the frontiers in the populism literature.
Fact 13: Trust in parliaments has declined — but not by as much as you’d think
Beyond who votes and for whom, we also need to consider broader attitudes toward political institutions — and whether the public still trusts the system itself. I don’t think I will shock anyone when I say that trust in parliaments has decreased in most European countries over the past four and half decades. What is perhaps more surprising is that this decline has been neither steep nor uniform. This finding emerges from a new paper by Valgarðsson et al. (2025), who harmonised thousands of surveys to examine the evolution of trust.

Given my scope conditions, I focus here on their Europe-related results. Estimating Bayesian latent trait models, the authors show that in countries, such as France, Greece, Italy, Portugal, and Spain, people place less trust in parliament, with notable drops around the 2008 financial crisis (also Ireland). Conversely, nations like Denmark, Norway, Sweden, and Switzerland have experienced rising trust in parliament — and in many other nations trust has been pretty constant.
Fact 14: Parties have become more decentralised
The final stylised fact that I want to put on the table relates to the nature of political parties. These have grown increasingly decentralised, granting more decision-making power to members, particularly in leadership selection. Georgia Kernell (2025) documents this shift in her forthcoming book, of which I do not own a digital copy (so no graphs). The rise of primaries in the US (Hirano and Snyder 2019), or the fact that — in some parties — coalition treaties now have to be “ratified” by members (e.g. the German SPD) also bear out this Kernell’s more general observation.
“So what?”, you might say. Why bother? The answer is simple: party members tend to hold rather extreme policy preferences — both relative to the party’s voters and all voters. By devolving more power to members, decentralisation therefore creates stronger pressures on the party’s top brass to move away from electorally promising positions in the policy space. I am fond of the paper by Wager et al. (2022), who have some very neat graphs that make this point in the British case.
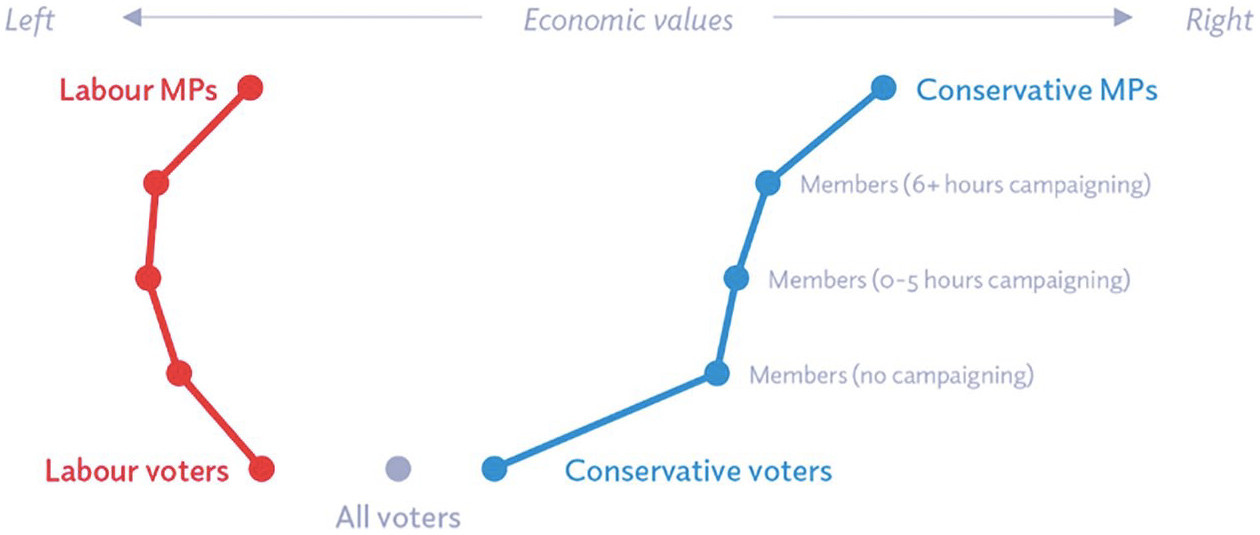
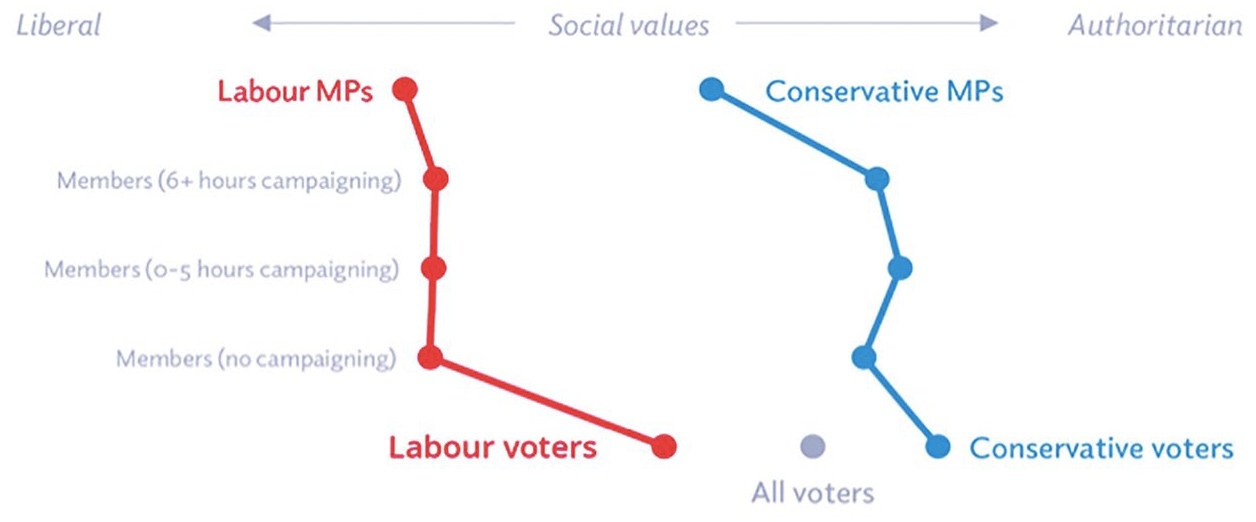
Drawing on the British Election Study, the Party Members Project Survey, and a survey of MPs (in early 2020), they find that Conservative MPs are more right-wing economically than both their voters and party members, whereas Labour MPs are pretty much aligned with their voters (their members are more left wing). On social values, however, both Labour and Tory MPs are more liberal than their members and voters. Now, this is not to say that granting more power to members is necessarily bad. After all, there could be an Aldrich-like (1983) rationale, where decentralisation is used to mobilise activists and improve the efficacy of electoral campaigns. If the expected vote gains from better campaigning exceed the expected losses from taking moving away from one’s voters, then decentralisation makes perfect electoral sense. For the record, I think there is more to it than that, but that is for another time.
Conclusion and outlook
The trends examined above paint a picture of European politics having undergone a profound transformation over the past five decades. On the demand side, we observe shifting voter coalitions, declining turnout among, and the growing salience of non-economic, cultural issues. On the supply side, mainstream parties have converged on economic policy, and the structure of political competition has become increasingly two-dimensional.
While economic debates once structured much of party competition, cultural and identity-related issues now play an ever more central role. This shift has put mainstream parties in a bind. After converging toward the economic centre, they have increasingly found themselves outflanked on the cultural dimension — to the left by cosmopolitan and environmentally focused green parties, and to the right by culturally conservative, nativist populist ones. This has made it substantially harder to hold together broad electoral coalitions.
The resulting realignments in voting behaviour are visible across multiple dimensions. Voters with higher education but lower income are increasingly gravitating toward the centre-left or Green parties, while lower-education voters — once the backbone of social democracy — have become more likely to abstain or turn to right-wing populists. Political geography and generation further segment the electorate: younger, urban, highly educated voters are overrepresented among the new left; older, rural, or post-industrial constituencies are more likely to support the radical right or abstain. Education and income, once strongly aligned in voting patterns, have diverged as independent axes of political behaviour.
These developments are common to many countries but unfold at different speeds, and intensities, shaped by national institutions, party systems, and political histories. Understanding the interplay between these general trends and country-specific trajectories is the essence — and indeed the lifeblood — of comparative political science.
The next post will examine explanations for the rise of right-wing populism, critically engaging with debates over economic insecurity, cultural backlash, and political trust. In doing so, we’ll return to many of the stylised facts discussed here. From there, I’ll survey the literature on the consequences of radical right success and explore what, if anything, can be done to mitigate these developments — or, at the very least, deal more effectively with the radical right.
I will use these terms synonymously.
It is worth noting that alternative definitions of populism exist. Weyland (2001) distinguishes between cumulative definitions, which blend attributes from various domains, and political re-definitions emphasizing populism as a strategy for gaining and exercising power. Dornbusch and Edwards (1990) emphasise populism’s economic implications, notably heavy redistribution combined with neglect for fiscal discipline. Additionally, Müller (2016) expands Mudde’s definition by explicitly including identity politics—highlighting divisions based on ethnicity, religion, or culture. Operationalising these definitions can also vary, with scholars such as Norris and Inglehart (2016) and Akkerman, Mudde, and Zaslove (2014) using survey data and principal component analysis to measure populist attitudes. These measures typically employ a compensatory approach, allowing individuals to score low on one dimension (e.g., anti-elitism) but high on another (e.g., populist rhetoric), balancing out to identify them as populist overall. Wuttke, Schimpf, and Schoen (2020), however, critique compensatory approaches because they do not ensure that respondents meet minimum thresholds across all conditions that are typically deemed necessary and jointly sufficient for populism. Instead, they advocate for non-compensatory measures, requiring individuals to meet minimum criteria on each dimension separately, thus providing an operationalisation of populism that is consistent with defining the latter in terms of necessary and jointly sufficient conditions.
Because we count both the gains and losses of vote share, the sum of absolute differences double-counts the total amount of change. Every vote that moves from party A to party B shows up as a loss for A and a gain for B. So to get the net change, we divide by 2.
This distinction is important, they claim, since the latter is a sign of healthy party competition, whereas the former tends to undermine party system institutionalisation. I am not sure I agree, but just FYI.
Common refers to parties present in both elections; the other two terms are self-explanatory.
In contrast, Italy and Greece saw their centre-right parties either maintain dominance or quickly consolidate after democratisation. Italy’s Christian Democrats held power for much of the post-war period until the party system collapsed in the early 1990s, partly under the weight of the Clean Hands corruption scandal, which exposed widespread graft and delegitimised much of the political class. This created a vacuum on the right that was swiftly filled by Silvio Berlusconi, who, despite only briefly serving as Prime Minister in the 1990s, rapidly restructured the centre-right around his newly formed Forza Italia. His political style — media-driven, populist, and personalistic — left a lasting imprint on Italian politics. Berlusconi would return to power for much of the 2000s, consolidating his status as the dominant figure on the Italian right for nearly two decades. In Greece, New Democracy emerged after the fall of the junta in 1974 and quickly established itself as one of the two dominant parties, retaining a central role until the upheavals of the Eurozone crisis.
On the rise of social democratic parties, see on
and Sprague (1988); on their decline, see Benedetto et al. (2020), Rennwald and Pontusson (2021), Häusermann and Kitschelt (2024). On the logic of “golden-age” (~1945 to mid-1970s) social democracy, see Katzenstein (1985), Przeworski and Wallerstein (1988), Wallerstein (2008), Moene and Wallerstein (1995, 2003). Roughly speaking, golden-age social democracy rested on the following (self-enforcing) compromise: labour, in the form of powerful unions, agreed to let capitalists pursue economic globalisation (e.g. wage restraint in open economies); in return, capitalists agreed to universal suffrage and collective bargaining. This compromise was sustained by (a) unions' ability to credibly threaten strikes (and inflict economic harm), and (b) capitalists' ability to leverage the mobility of capital to credibly threaten exit. Katzenstein (1985) emphasizes how small European states institutionalized this compromise through corporatist arrangements and consensus-oriented policymaking. Powerful structural exogenous developments undermined the capital-labour compromise in ways that were favourable to capital and unfavourable to semi-skilled and unskilled labour (Boix 2019), e.g. automation and import competition. The degree to which these unfavourable developments undermined labour's bargaining power was, at least partly, endogenous to political decisions, e.g. money in politics and lobbying, lack of (descriptive) representation, and the rhetorical “war” on deservingness (i.e. castigating recipients of welfare benefits). On how social democrats responded to this brave new world, see, inter alia, Boix (1998), Rueda (2005, 2007), Beramendi and Rueda (2007), Beramendi et al. (2015), Iversen and Soskice (2019), and Vlandas (2023).See also this presentation of the book by Boix and his subsequent discussion with Tim Besley.
This also matters substantively. Too often, the “cultural” dimension is treated as a residual non-economic category. The risk is that this dimension then represents a hard-to-interpret amalgam of non-economic attitudes (attitudes towards immigration, European integration, moral universalism/particularlism, etc.). In that instance, such “second-dimensional” arguments obscure causal mechanisms — a point to which I will return in the next post.
Enke defines moral universalism as the extent to which individuals apply the same moral obligations to distant others as to close in-groups, finding that those with universalist outlooks are more likely to support redistribution, foreign aid, and environmental protection, while particularists tend to prioritise policies like law enforcement and immigration control. His work demonstrates that universalism is a psychologically stable trait, correlated with demographic factors and associated with distinct patterns of political behaviour across Western democracies. Zollinger, in contrast, examines how these moral orientations manifest in everyday political language. Analysing open-ended survey responses in Switzerland, she shows that people’s spontaneous descriptions of in-groups and out-groups reflect an emerging cleavage aligned with the universalism–particularism divide. These identities, she argues, map onto support for either new-left or far-right parties, reinforcing the idea that moral orientations shape not only policy preferences but also the structure of political identities and partisanship.
This paper caused quite a stir in the political science profession, with many (i) lamenting the unduly short shrift that the authors gave to the relevant political science literature and (ii) taking issue with the ‘Brahmin left vs Merchant right’ interpretation of their data. While I am extremely impressed by the harmonised dataset that Gethin et al. compiled, I agree with (ii). See Abou-Chadi and Hix (2021).
The reason for this is straightforward: in 1971 credit lost its gold boundary. That let it outpace productivity and ratchet inequality, which reshaped society more than people realized. Once living standards diverged, temperaments hardened into different coping ideologies: some leaned toward redistribution, others toward nativism, others toward technocracy. What looks like “cultural polarization” is downstream of that structural credit shift. You can see it compound over time.